Please enter your email and website or LinkedIn to receive more information about our free and paid accounts.
Thanks! We'll reply to you shortly.
Please enter your email address below and we’ll send you instructions on how to change your password.
Enter your new password below or generate one. The password should be at least ten characters long. To make it stronger, use upper and lower case letters, numbers, and symbols.
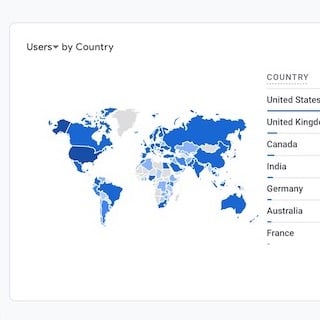
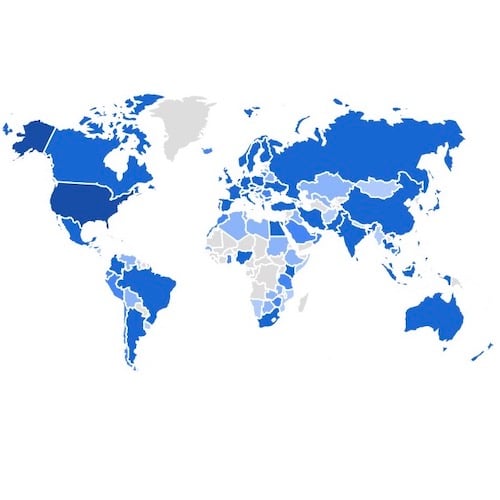
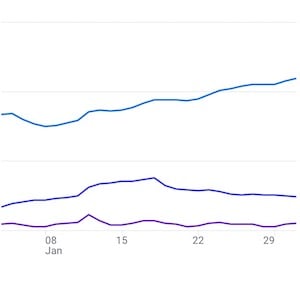
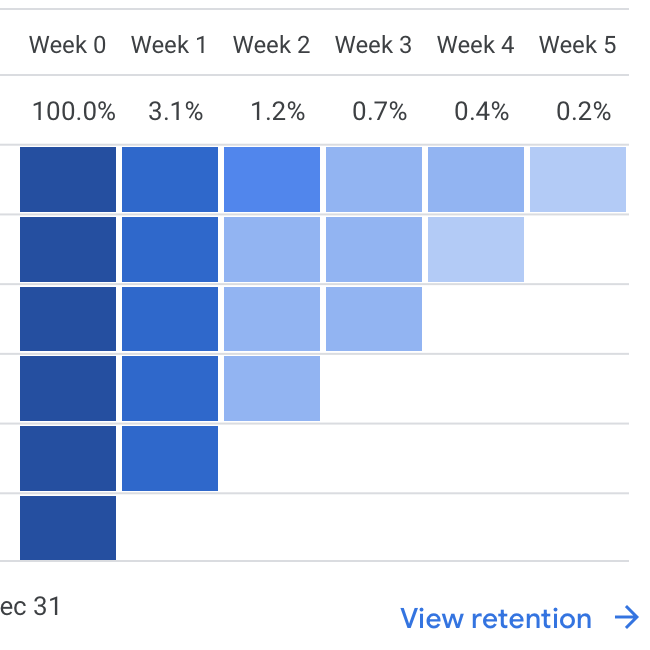
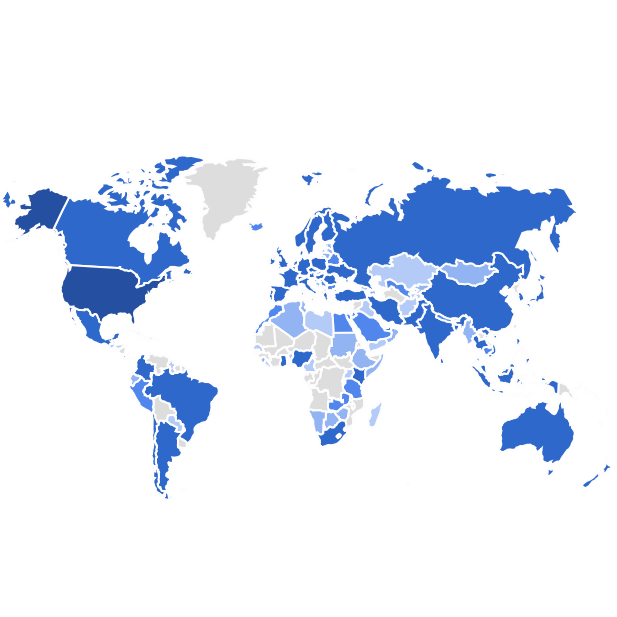
In January, our website was visited by 11.0K Users, who navigated through a total of 55.1K pages, dedicating an average time of 2 minutes and 2 seconds to interact with our content.
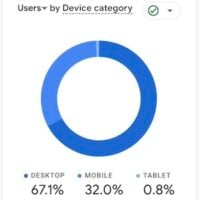
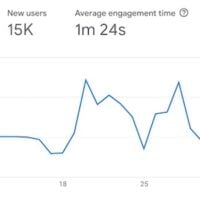
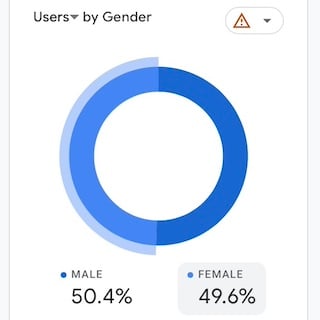
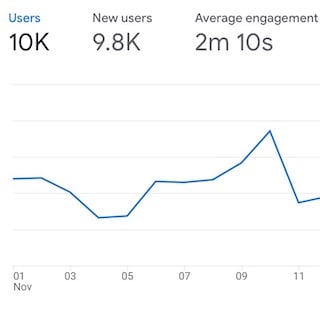
In November, our website attracted 10.4K Users who browsed through 50.5K pages, spending an average of 2 minutes and 10 seconds engaged with our content.
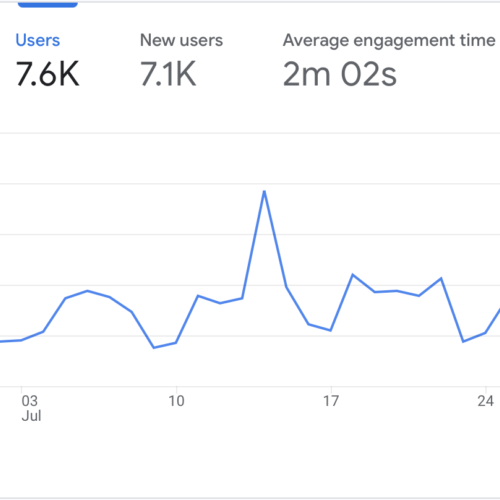
In July, our website welcomed 8.9K visitors who browsed through 124K pages, each spending an average time of 2 minutes and 9 seconds interacting with our content.
In this monthly report card article, we will be taking a closer look at the Google Analytics statistics for our website in January 2023. Click to read more.
We’ve seen an increase in the amount of Users on our website last month. If you are curios to learn more details about analytics, click here to see how Wonderful Machine’s website performed in November.
According to the data from Google Analytics 4, Wonderful Machine’s website had 8.6K Users in October. 8K Users visited the website for the first time. The average engagement time in October was 2m 11s.
The total number of Wonderful Machine’s Users in September was 9.3K, while 8.8K were New Users (those who visited our website for the first time). The average engagement time in September was 2min 12s.
In August, the total number of Users on Wonderful Machine’s website was 9.7K. The number of New Users who visited our website for the first time was 9.2K, while the average engagement time was 1m 42s.
Starting from August, our monthly Google Analytics Report Card Articles will contain data available in Google Analytics 4 dashboard. Check out our July 2022 statistics.
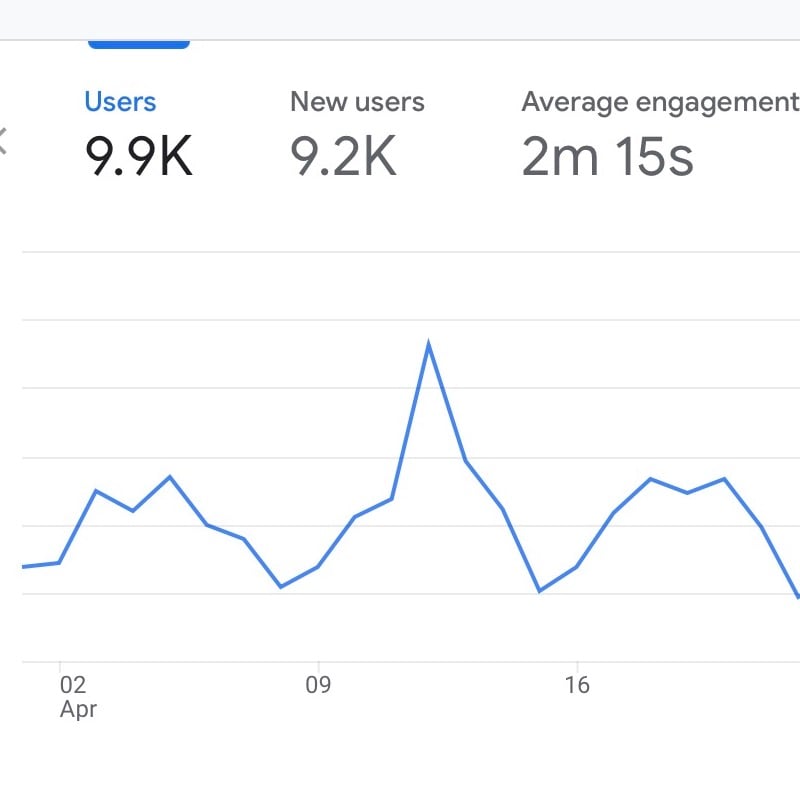
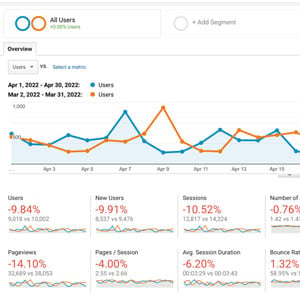
Google Analytics for WonderfulMachine.com were quite schlimm, as the Germans say, for April 2022. That means not good. However, the blog saw improvements. So with the ups and downs, we learn that the ship does rock with the tides.