Please enter your email and website or LinkedIn to receive more information about our free and paid accounts.
Please enter your email address below and we’ll send you instructions on how to change your password.
Our website had a total of 11K users who spent an average of 1 minute and 59 seconds engaging with our site in January.
The Reports Snapshot summarizes the website’s traffic, featuring details on the total number of users, new users, and the average duration of their engagement with our site.
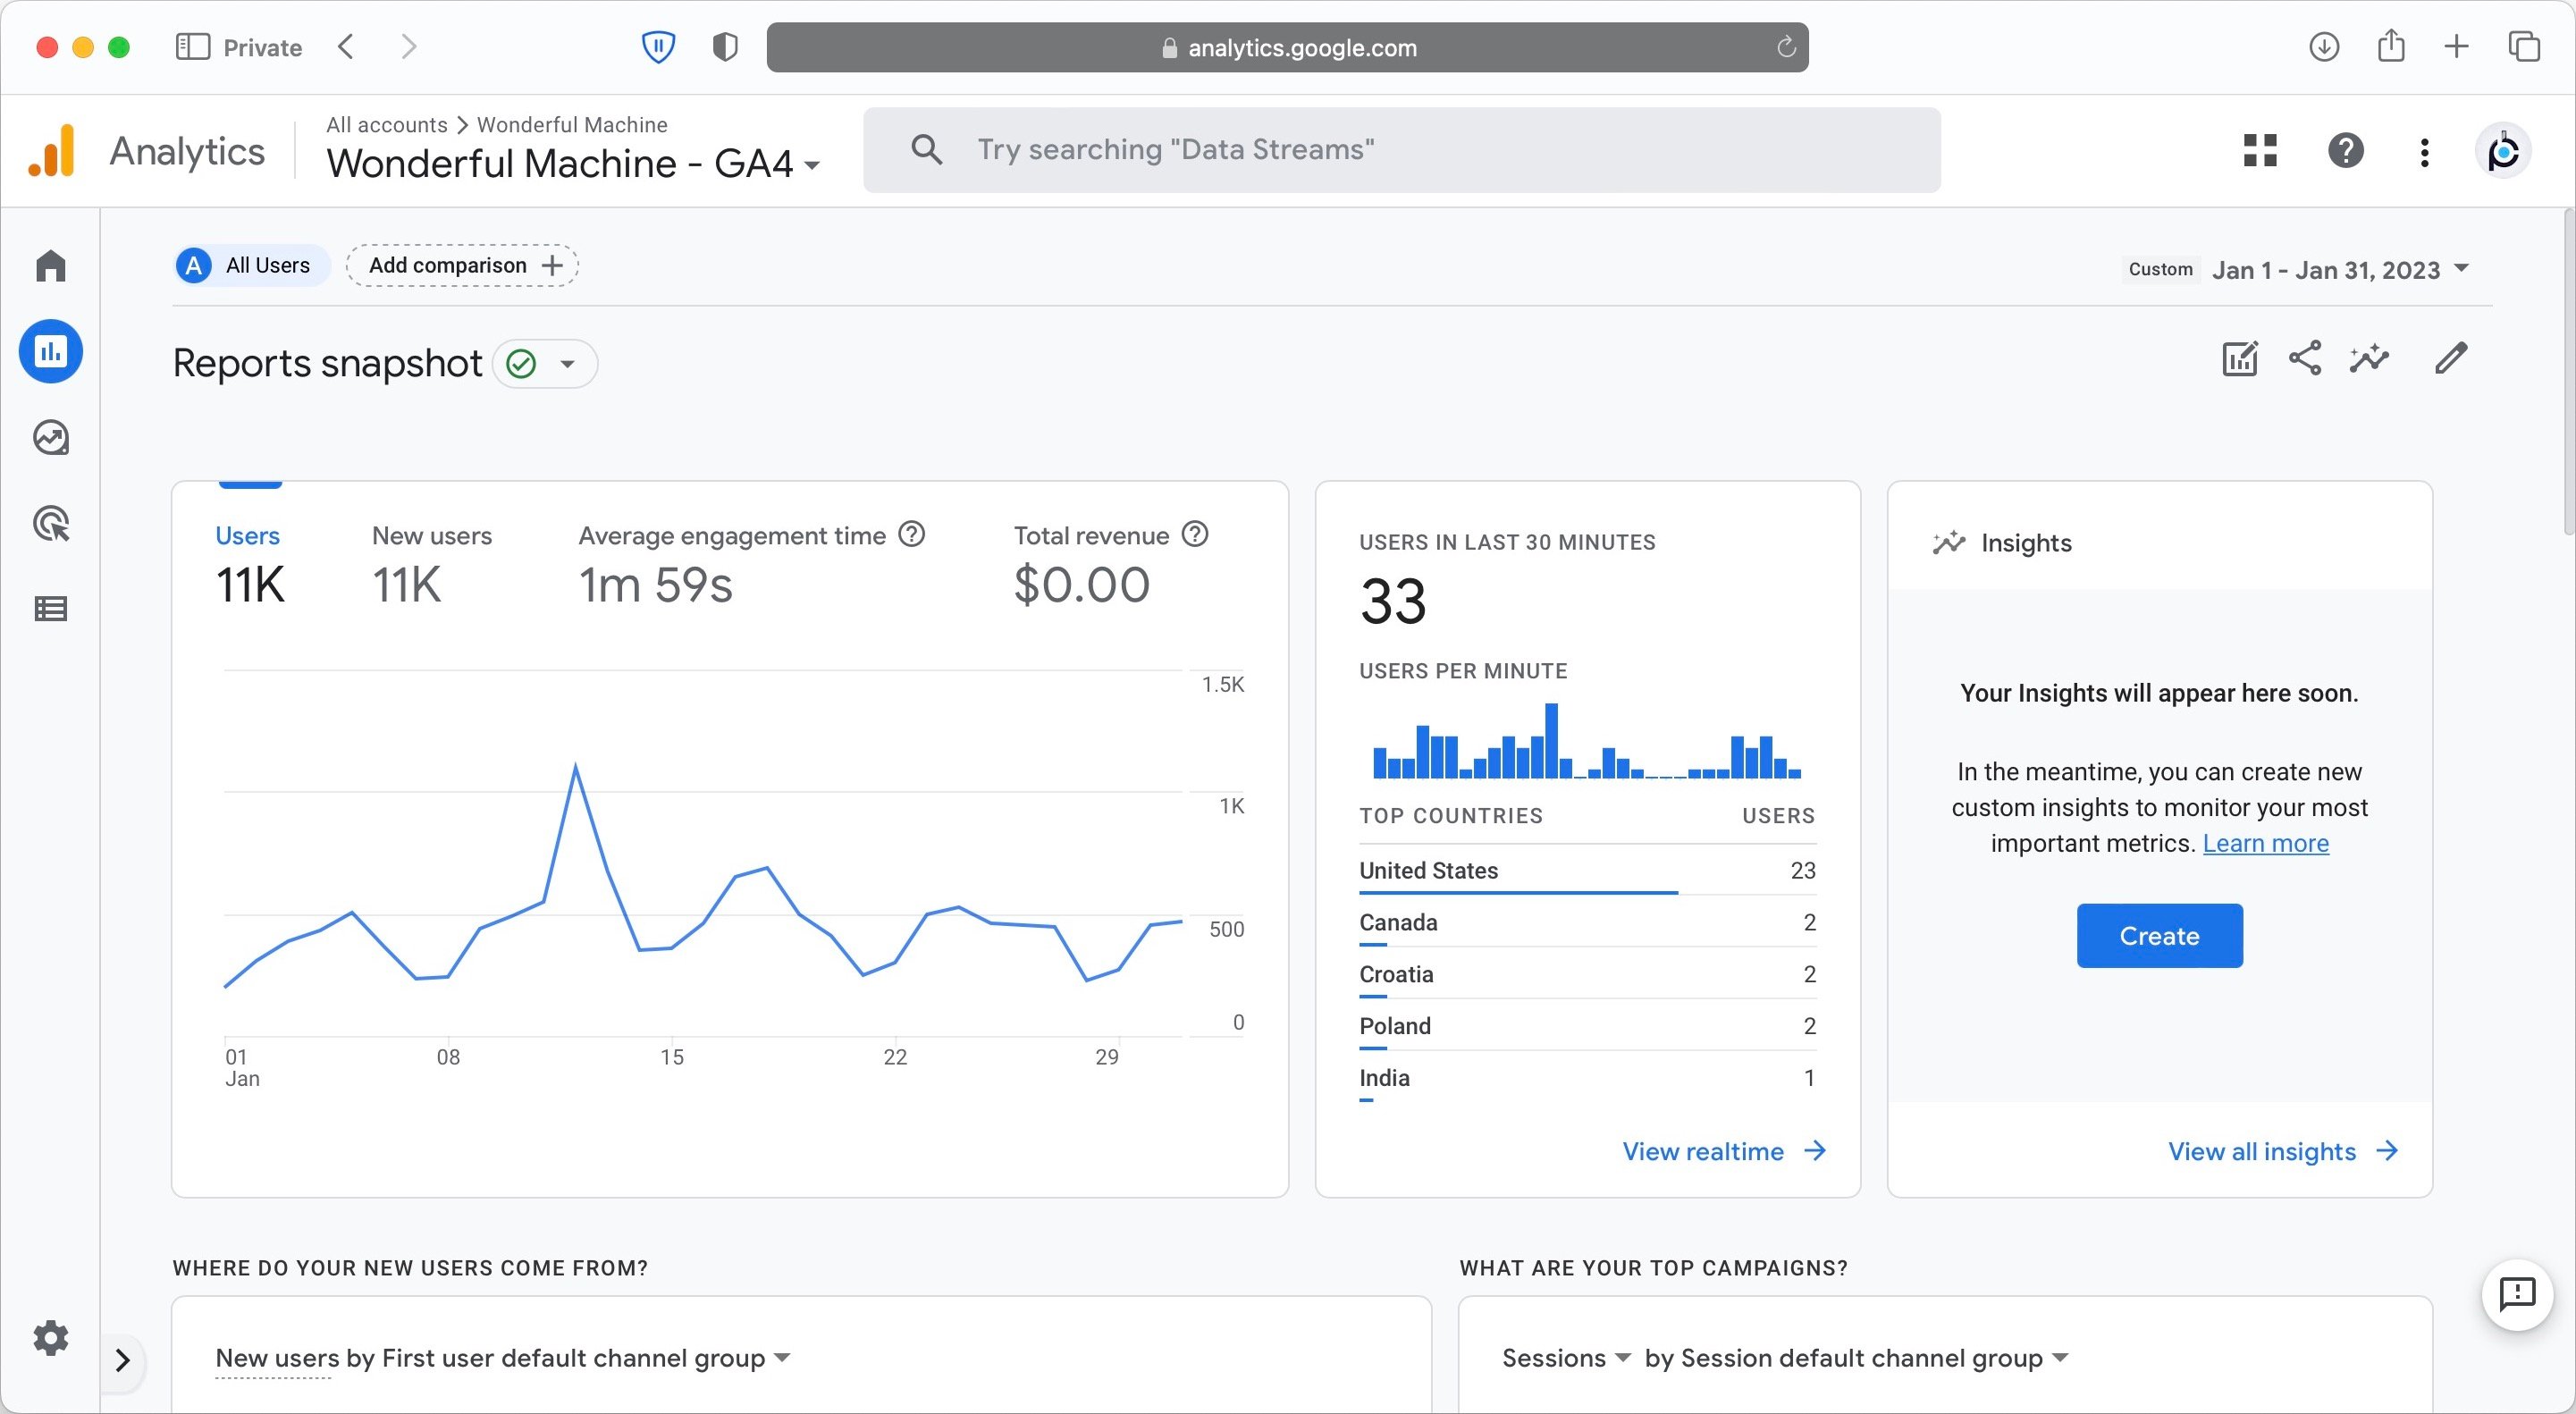
We saw an improvement in both traffic and average engagement time on our website in January. Our website had 11K Users. The average engagement time, which represents the total time they spent on the website divided by the number of Users, was 1 minute and 59 seconds.
A comparison between January traffic and our seven-month average is shown in the table below.
| Analytics category | January 2023 | 7-Month Average | % Change |
| Users | 11.1K | 8.6K | +27.9 |
| New users | 11.1K | 8.3K | +32.5 |
| Average engagement time | 1m 59s | 2m 02s | -2.5 |
The Demographics Overview on the Google Analytics 4 dashboard offers an in-depth view of the profile of our website’s users, including their geographic location (countries and cities), gender, and language.
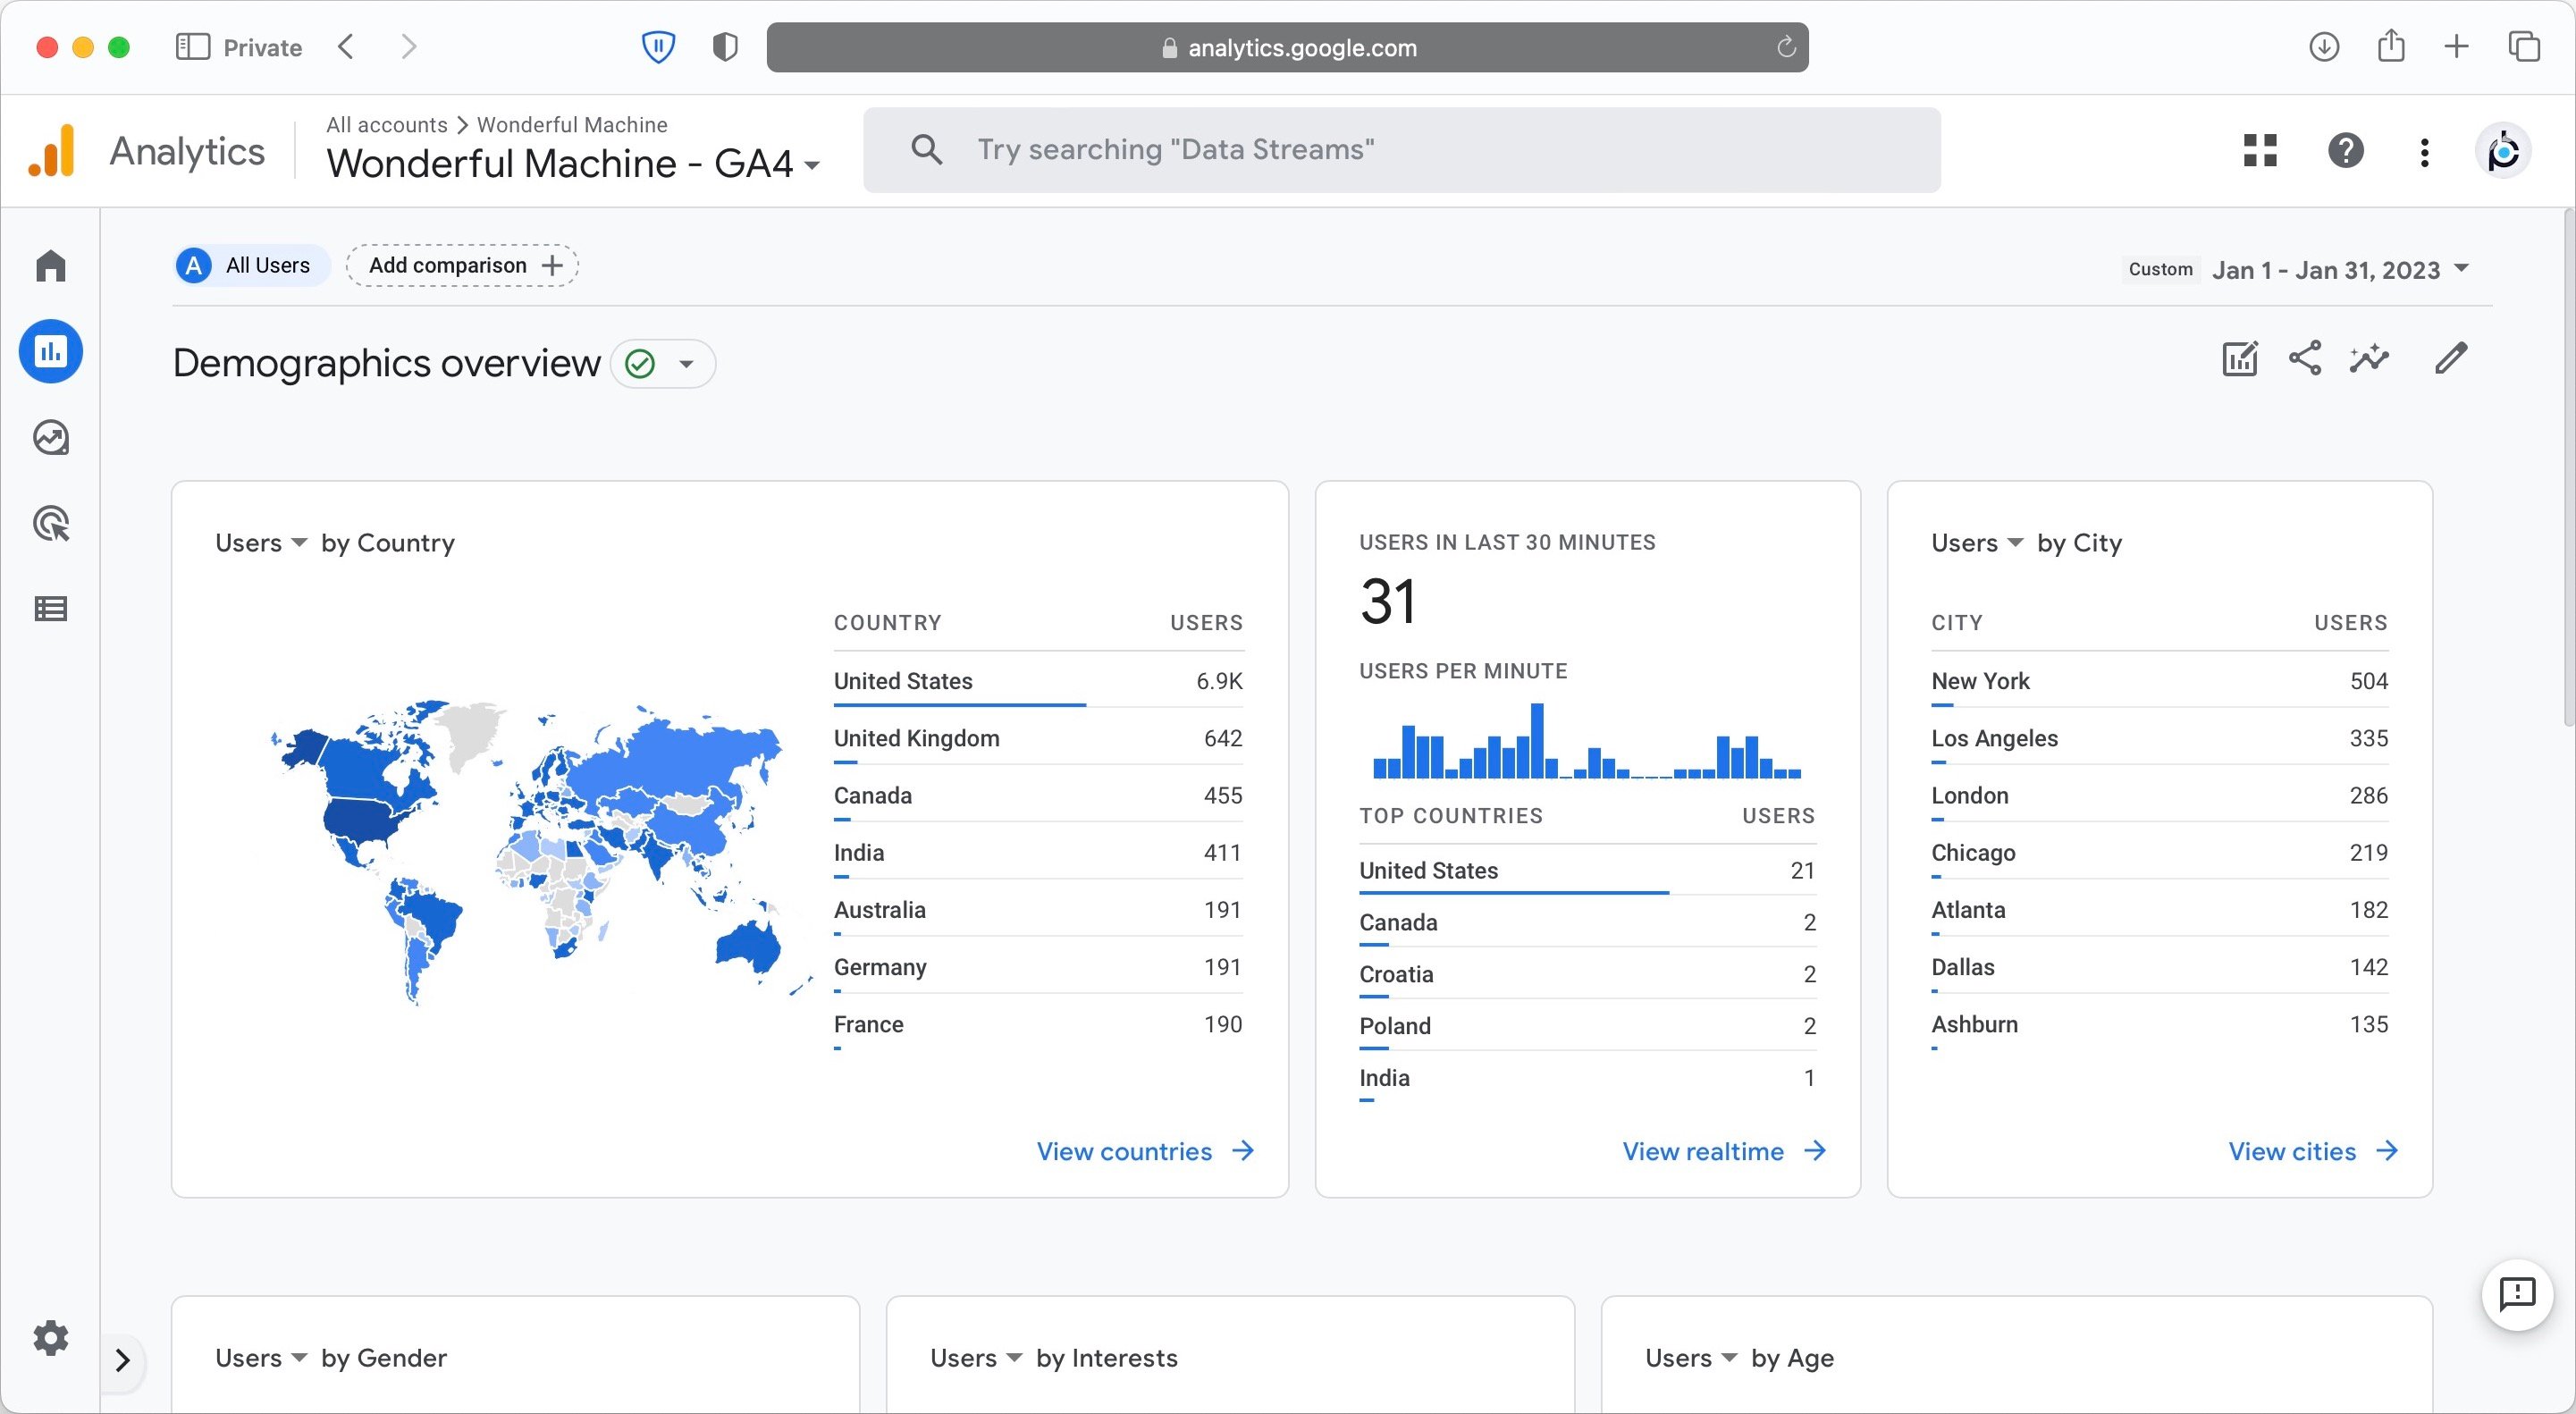
In January, the majority of our Users, approximately 60%, originated from the United States. The top five countries of origin for our Users were the United States, the United Kingdom, Canada, India, and Germany.
The top five cities where our Users live are New York, Los Angeles, London, Chicago, and Atlanta.
The Traffic acquisition report shows how Users found our website.
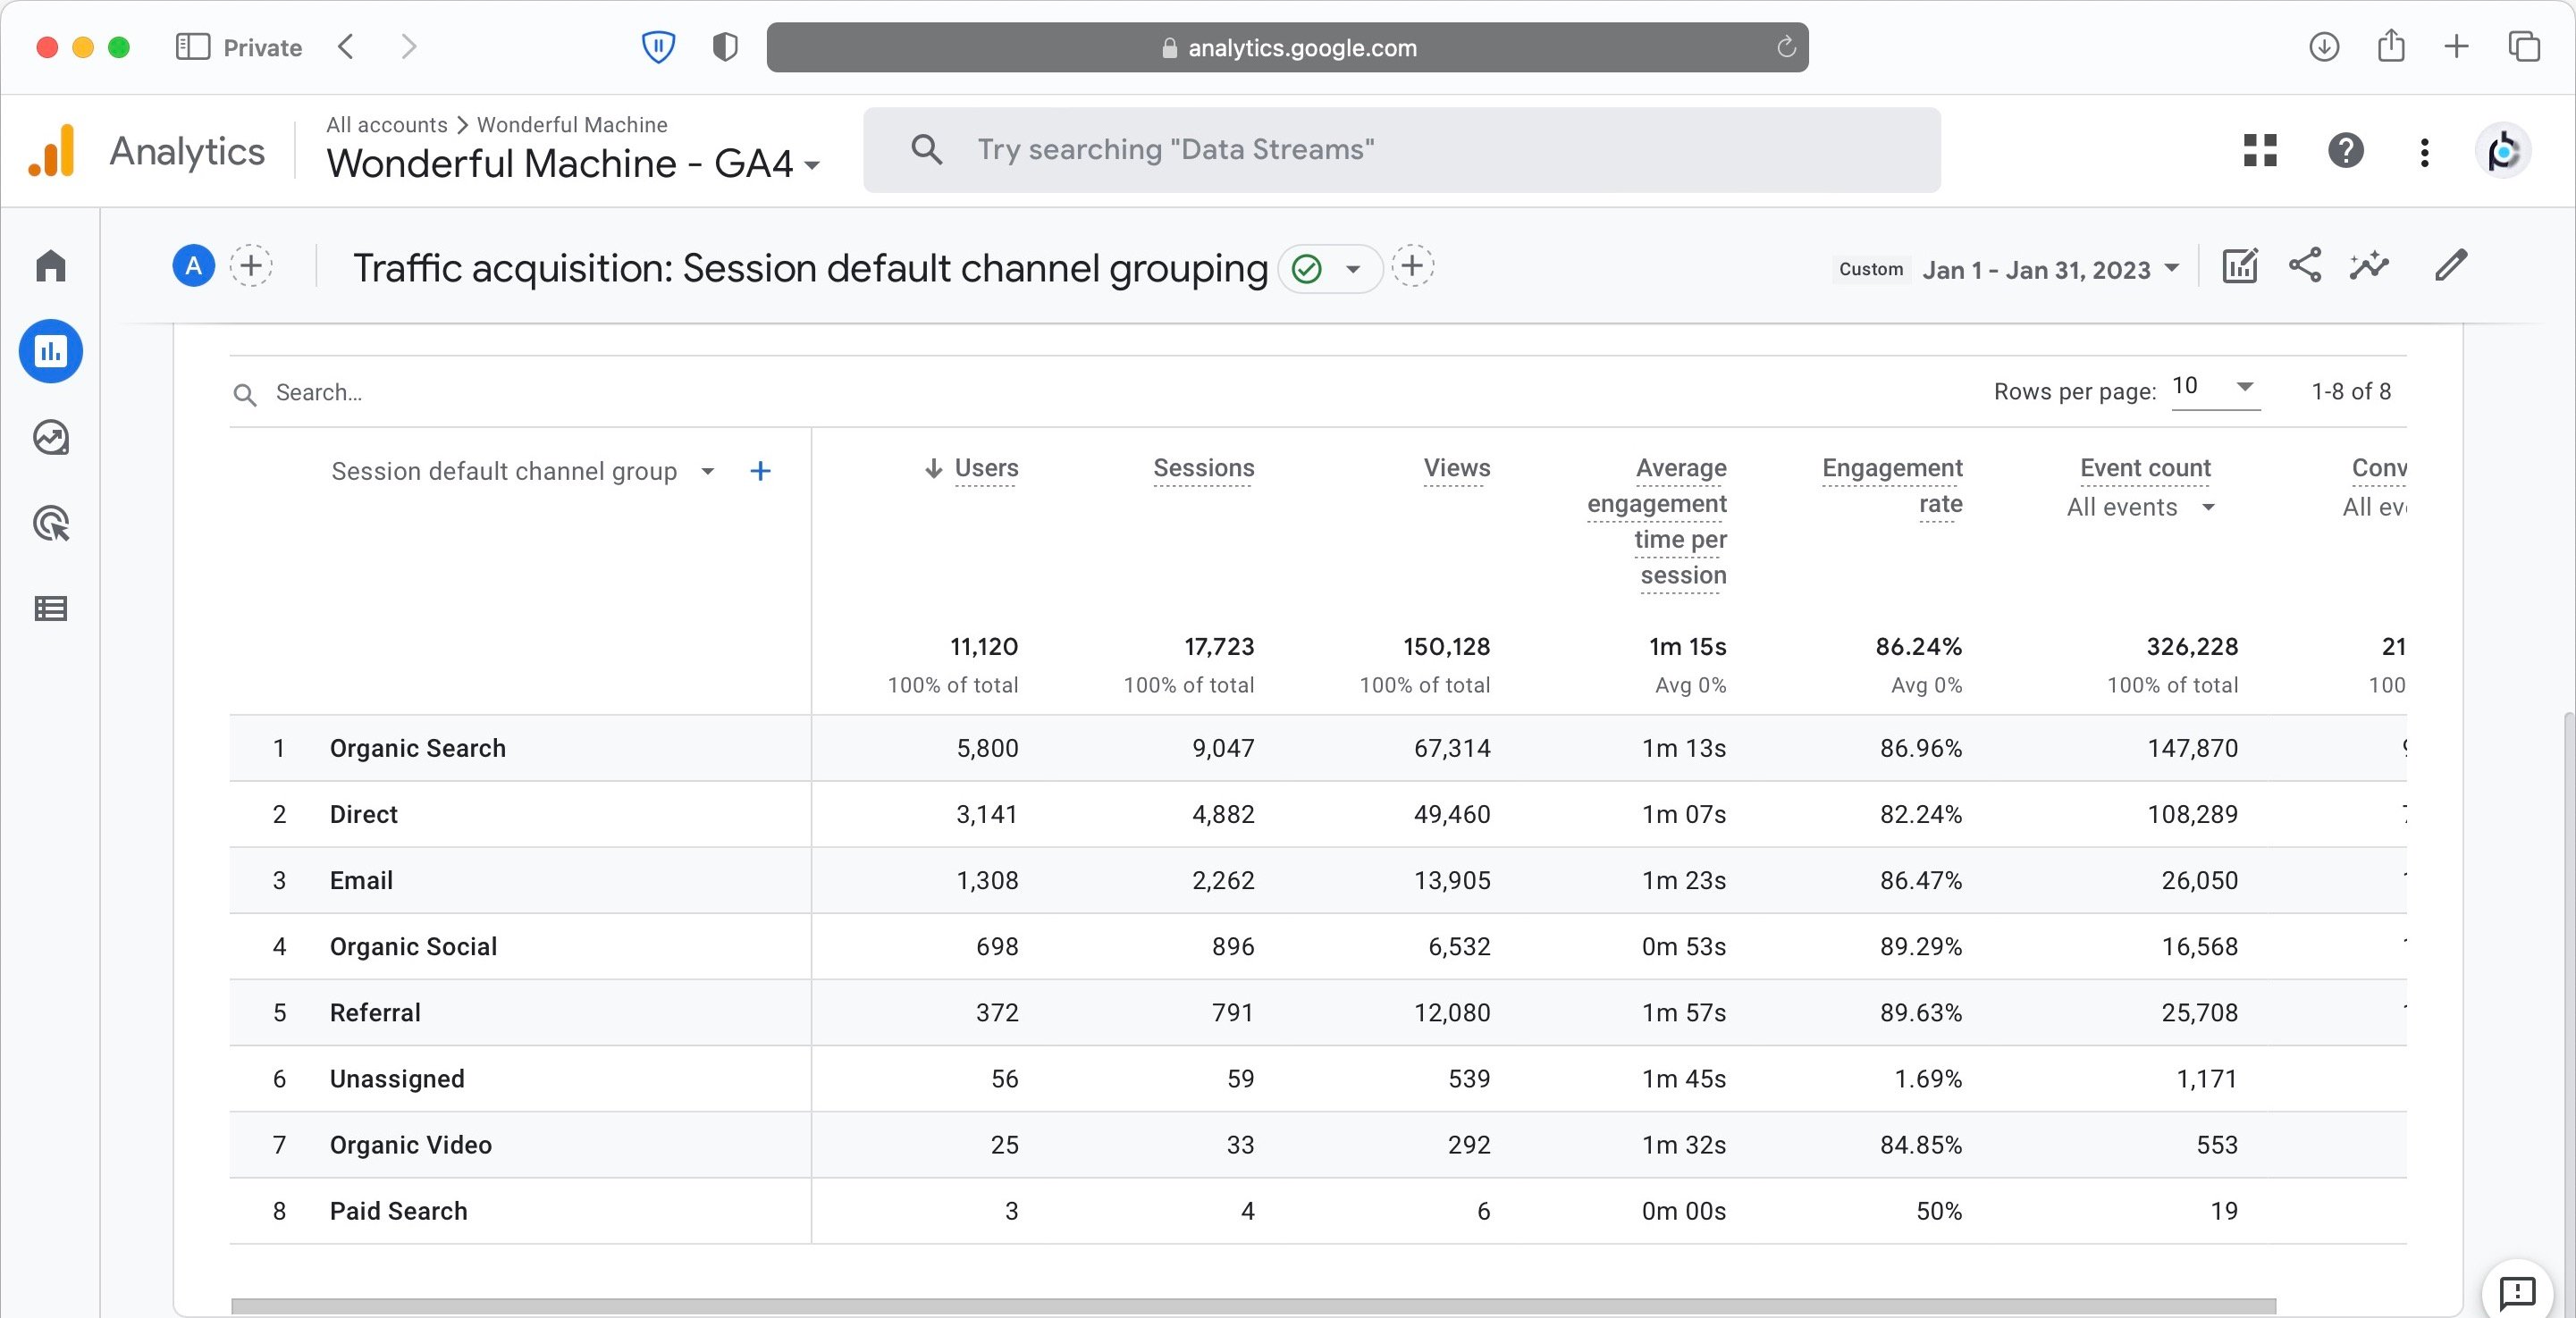
Our top traffic sources in January were Organic Search, Direct, Organic Social, Email, and Referral.
The Social Media Traffic Report displays the number of Users who accessed our website via links from various social media platforms.
In total, 682 Users reached our website through social media. Below is a breakdown of the social media traffic:
Here is a breakdown of the metrics we track for our Find Photographers page.
| Analytics category | January 2023 | 4-month average | % change |
| Users | 1.1K | 0.9K | +22.2 |
| Views | 5.0K | 4.4K | +13.6 |
| Views per user | 4.5 | 4.9 | -8.2 |
We’ve seen an increase in usage of our Find Photographers page in January, with 1.1K people using our photographer search and averaging 4.5 page views per person. Page view could represent a single search or the user scrolling through multiple search results pages (each page displays 25 search results).
The content on our blog posts and static pages serves a dual purpose, offering valuable information for our Users and also functioning as searchable material to draw visitors to our site. The Published and Intel blog articles were viewed 40.8K times in total. Meanwhile, the views for other pages experienced a 35% increase from the previous month, totaling 109.3K views.
| Analytics category | January 2023 | 4-month average | % change |
| Published and Intel blog views | 40.8K | 33.0K | +23.6 |
| Other pages views | 109.3K | 91.0K | +20.1 |
The top 5 articles on our Intel blog in January were:
The top 5 articles on our Published blog in January were:
Have questions about how we promote our photographers? Check out our Membership page. Want to know how you can get the most out of your Wonderful Machine membership? Check out our Jumpstart page or just reach out!