Please enter your email and website or LinkedIn to receive more information about our free and paid accounts.
Please enter your email address below and we’ll send you instructions on how to change your password.
In February, our site attracted 15.3K Users who browsed through 67.7K pages, spending an average of 1 minute and 29 seconds engaging with our content. The notable increase in traffic, especially from Poland, can be attributed to an influx of spam traffic, which artificially boosted our visitor statistics and distorted our overall site engagement metrics.
The Reports Snapshot emphasizes key website metrics, concentrating on the total number of Users, New users, and the average time they spend interacting with our site’s content.
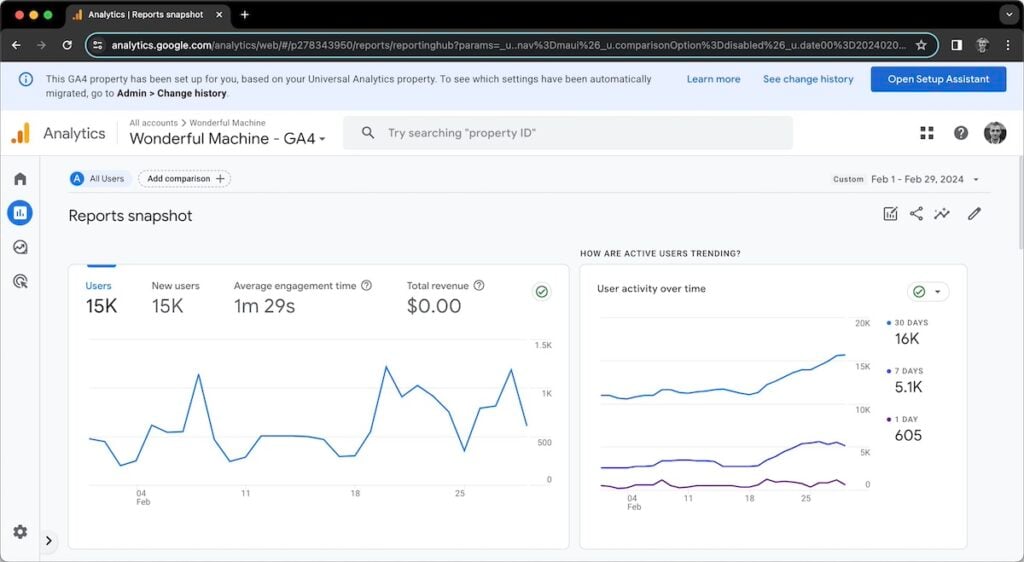
February experienced a notable surge in traffic, setting a new high compared to the average of the past 12 months, making February the best month we’ve had in terms of traffic so far.
| Analytics category | February 2024 | 12-Month Average | % Change |
| Users | 15.3K | 9.4K | +62.8 |
| New users | 15.0K | 9.3K | +61.3 |
| Average engagement time | 1m 29s | 2m 14s | -33.6 |
Even though the statistics look great, we noticed a couple of strange things:
When analyzing the traffic, we discovered that the source are a couple of websites with random domain names. We concluded that it must be some kind of bot traffic, since almost 4K Users opened our homepage, and then immediately left. It resulted in a drop in Average engagement time, an increase in referral traffic, and an increase in the number of visits from Warsaw, Poland. We will keep monitoring traffic to see if this will stop happening in March.
This part of Google Analytics offers information on the geographical locations, gender, and language preferences of our Users.
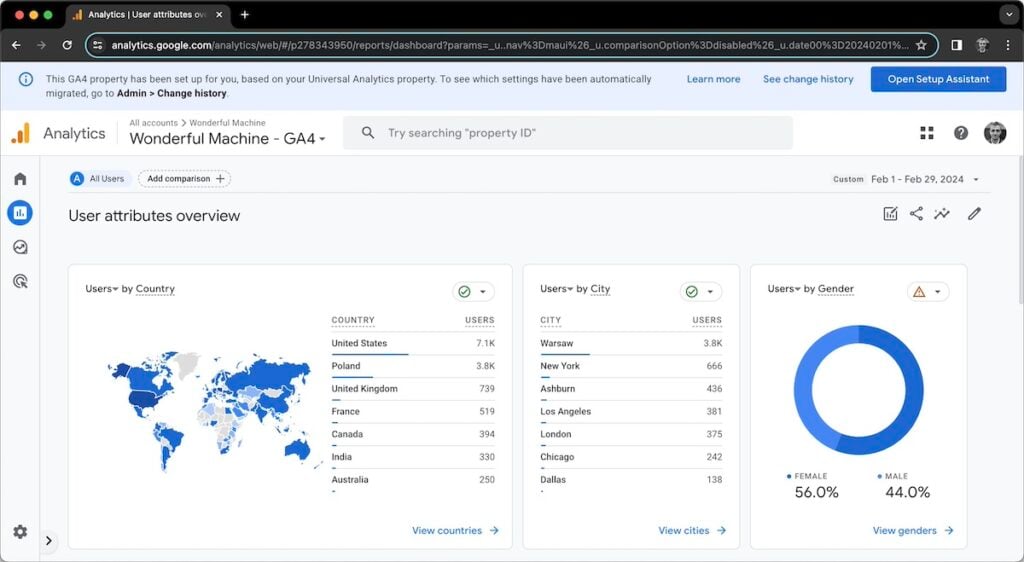
In February, most of our website’s traffic, making up 46%, originated from the United States, with Poland, United Kingdom, France and Canada following in order.
When looking at the traffic by cities, Warsaw was at the forefront in terms of visits, with New York, Ashburn (Virginia), Los Angeles, and London trailing behind.
The Traffic Acquisition report reveals the methods through which Users find our website.
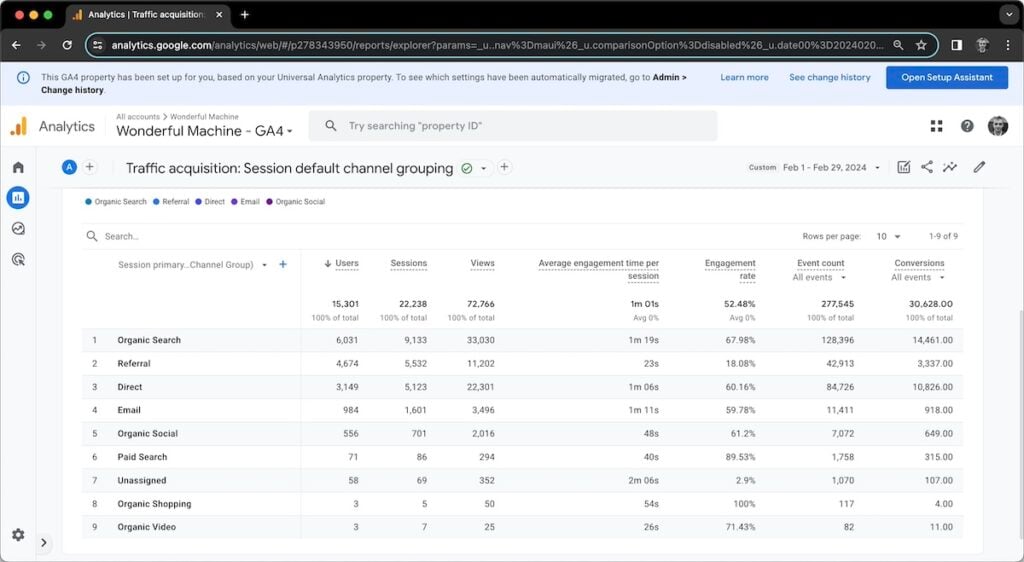
In February, the primary channels driving traffic to our site included Organic Search, Direct, Email, Referral, and Organic Social.
In February, 533 visitors discovered our site through our social media channels. Here’s a closer look:
Our site includes publicly accessible directories for Photographers and Crew, as well as private directories for Clients, Agents, and Resources.
During February, 1.6K Users browsed a total of 7.6K profiles. According to Google Analytics 4 (GA4), scrolling through a page with 25 profiles counts as one View.
| Page | Users | Views |
| Find Photographers | 1.4K | 5.3K |
| Find Crew | 154 | 659 |
| Find Clients | 42 | 1.0K |
| Find Agents | 22 | 648 |
| Find Resources | 9 | 20 |
Our website had a total of 15.3K Users in February. Out of those, 2.4K Users visited the “Find Photographers” page. Of those, 1.4K Users searched for a photographer. In total, there were 5.3K Photographer searches.
Our “Find Photographers” page offers Users a choice between List View and Gallery View, with Gallery View set as the default on the homepage. Selecting the Find Photographers page from the Find menu, however, changes the display to List View. Although analyzing these findings can be complex, it’s clear that List View is the preferred method for browsing photographer profiles.
| Type | Users | Views |
| List View | 729 | 3.6K |
| Gallery View | 631 | 1.6K |
Of the 2.4K Users who navigated to the Find Photographers page, 1.0K interacted with photographer profiles, making a total of 7.4K clicks on different elements.
| Link Type | Users | Clicks |
| Website | 730 | 5.5K |
| 238 | 886 | |
| 82 | 283 | |
| About | 120 | 282 |
| 61 | 263 | |
| Unpublished | 43 | 168 |
| Phone | 22 | 35 |
| BTS | 12 | 19 |
| Agent | 4 | 7 |
| Ambassador | 1 | 1 |
Our website features an Unpublished section where photographers can showcase projects available for licensing, accessible through the Read menu or directly from each photographer’s profile.
| Page | Users | Views |
| Unpublished | 88 | 471 |
The static pages under the Consult and About menus received 59.2K views.
| Page | Users | Views |
| Stock | 61 | 69 |
| Consulting Services | 89 | 157 |
| Design | 77 | 113 |
| Marketing | 158 | 307 |
| Photo Editing | 111 | 163 |
| Pricing & Negotiating | 480 | 690 |
| Publicity | 10 | 14 |
| Shoot Production | 417 | 644 |
| Mission | 275 | 350 |
| Team | 374 | 549 |
| Successes | 79 | 108 |
| Press | 31 | 38 |
| Specialties | 82 | 163 |
| Membership | 367 | 566 |
| Jumpstart | 42 | 75 |
| Terms | 46 | 47 |
| Privacy | 5 | 5 |
| Contact | 99 | 118 |
Our Published and Intel blogs drew 8.5K views, serving the dual purpose of providing valuable information and attracting new Users.
Below is the traffic data for our website’s articles, tracked thanks to their consistent URL structure. We do not monitor traffic for Photographer Spotlights or Case Studies due to their varied URLs and because our aim with Spotlights is to highlight our members, and with Case Studies, to feature our consultants, regardless of the traffic these sections generate.
| Page | Users | Views |
| Expert Advice | 2.2K | 3.2K |
| Listicles | 1.4K | 1.8K |
| Specialty | 559 | 799 |
| Crew | 205 | 486 |
The top 5 Photographer Spotlight articles in February were:
The top 5 articles on our Published blog in February were:
The top 5 articles on our Intel blog in February were:
Have questions about how we promote our photographers? Check out our Membership page. Want to know how you can get the most out of your Wonderful Machine membership? Check out our Jumpstart page or just reach out!