Please enter your email and website or LinkedIn to receive more information about our free and paid accounts.
Please enter your email address below and we’ll send you instructions on how to change your password.
Our website had 8.3K visitors in June, visiting 147K pages, and an average interaction time of 2 minutes and 12 seconds.
The Reports Snapshot provides an overview of the traffic on our website, including details about the total number of users, new users count, and the average length of their interactions on our site.
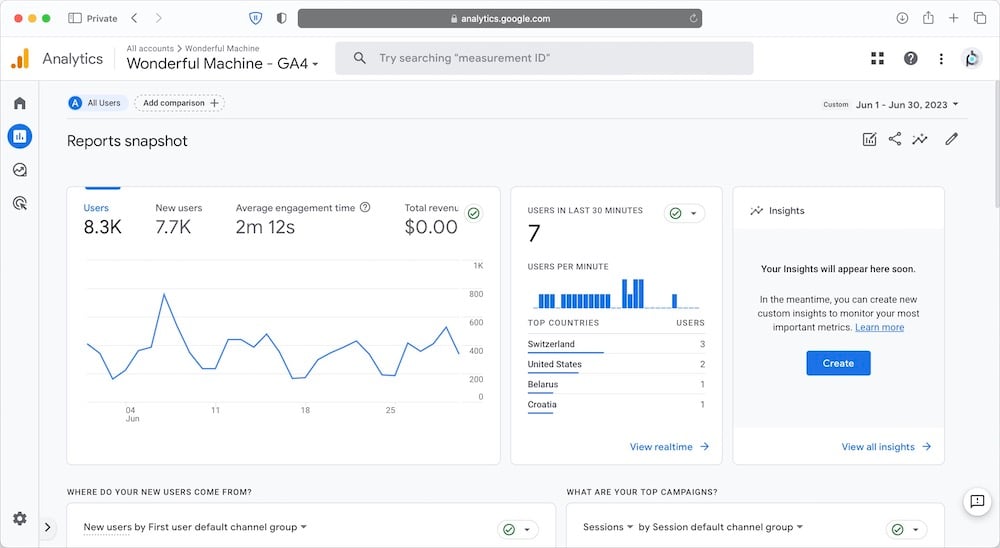
In comparison to our 12-month average, we noticed a minor decrease in our website traffic for June, recording 8.3K visitors. Among these, 7.7K were new visitors to the site. In June, the average time spent per user was 2 minutes and 12 seconds, obtained by dividing the total duration spent on the website by the user count.
The table below compares the traffic in June and our 12-month average.
| Analytics category | June 2023 | 12-Month Average | % Change |
| Users | 8.3K | 9.1K | -8.8 |
| New users | 7.7K | 9.1K | -15.3 |
| Average engagement time | 2m 12s | 2m 07s | +3.9 |
The Demographics Overview feature of Google Analytics 4 offers a thorough picture of the profile of our website’s users, including information about their geographic location (both country and city), gender, and language.
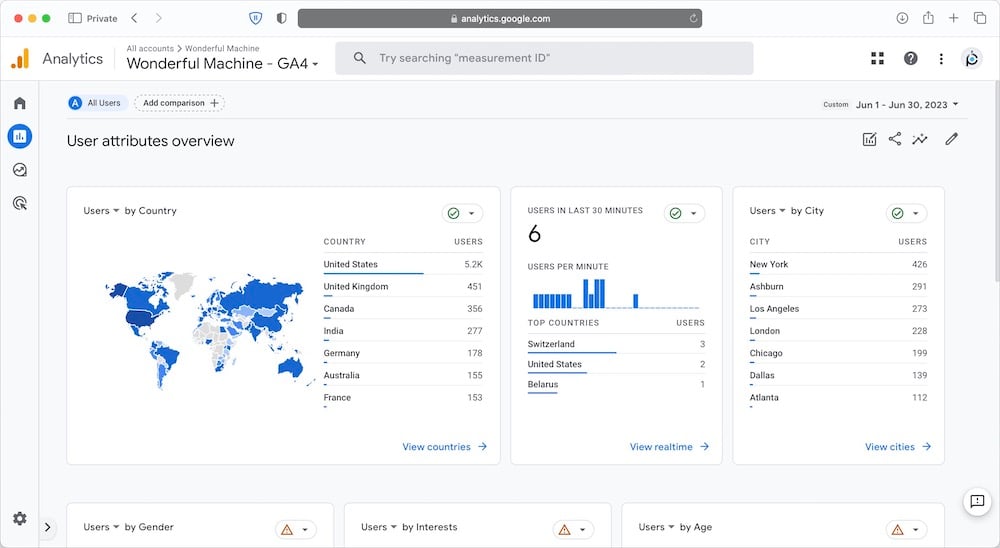
In June, around 65% of our website’s visitors were located in the United States. The primary countries from which users visited our website were the United States, followed by the United Kingdom, Canada, India, and Germany.
In terms of the predominant cities where our users are based, New York takes the top spot, with Ashburn, Los Angeles, London, and Chicago trailing behind.
The Traffic Acquisition report offers valuable insights into how users are finding and arriving at our website.
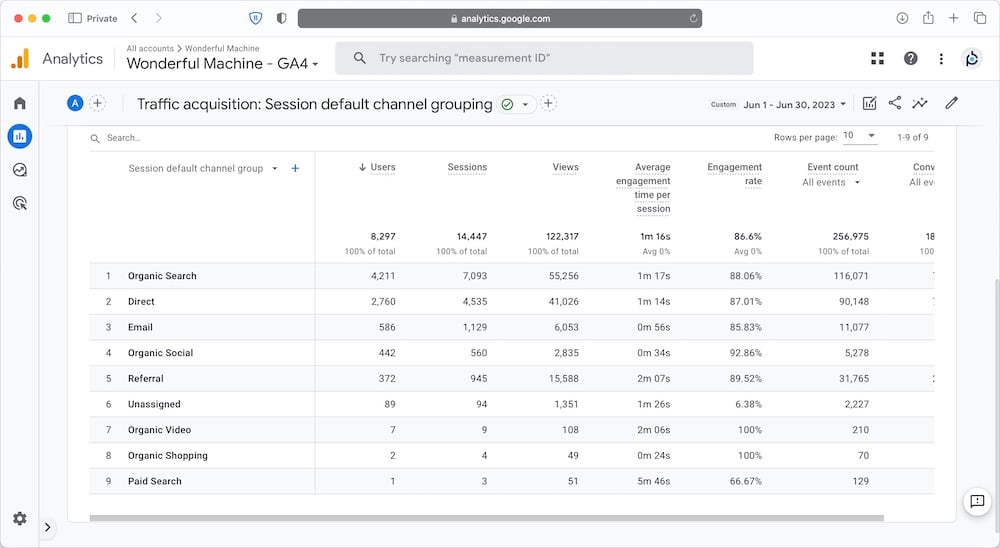
The top traffic sources for June included Organic Search, Direct, Email, Organic Social, and Referral.
The Social Media Traffic Report showcases the count of visitors who reached our website by clicking on links from our social media platforms.
In total, 415 users landed on our website via social media channels in June. Here is a detailed breakdown of the traffic originating from social media:
Here’s a detailed analysis of the metrics we track for our Find Photographers page.
| Analytics category | June 2023 | 9-month average | % change |
| Users | 1.0K | 1.0K | +0.0 |
| Views | 3.7K | 4.8K | -22.9 |
| Views per user | 3.7 | 4.8 | -22.9 |
In June, the activity on our Find Photographers page decreased compared to our 9-month average, with 1.0K users taking advantage of our photographer search feature, averaging 3.7 page views each. A single-page view could encompass one search or several pages of search results, each presenting up to 25 search outcomes.
We offer our users two distinct methods of looking for photographers. They can either browse photographer galleries or search through photographer profiles. Although the profile view equips users with an abundance of valuable information about photographers, sometimes, browsing galleries proves more convenient. Below is a comparative analysis of usage between the Find Photographers and Browse Photographers pages.
| Type | Searches | Users |
| List | 2.6K | 595 |
| Browse | 1.1K | 450 |
In June, we recorded 1.2K users who engaged with the ‘Find’ button. These 1.2K users accounted for a total of 6.0K clicks on this button. Let’s delve into the detailed breakdown.
| Page | Clicks | Users |
| Find Photographers | 2.5K | 754 |
| Find Clients | 1.1K | 42 |
| Homepage | 569 | 450 |
| Find Crew | 565 | 123 |
| Read Intel | 407 | 109 |
| Read Published | 302 | 55 |
| Find Agents | 191 | 13 |
| Read | 157 | 40 |
| Find Resources | 132 | 10 |
| Find Unpublished | 18 | 39 |
We had 692 users who interacted with the photographer profiles. This interaction is defined by clicking on their website, email, phone, Instagram profile, LinkedIn profile, about section, and so on. These 692 users accumulated a total of 5.3K engagements. Here is a detailed breakdown.
| Link type | Clicks | Users |
| Website | 3.7K | 517 |
| 430 | 157 | |
| Phone | 367 | 12 |
| About | 203 | 93 |
| 134 | 54 | |
| 101 | 39 | |
| Unpublished | 48 | 26 |
| BTS | 12 | 9 |
| IWMF | 4 | 4 |
| Wikipedia | 1 | 1 |
Our blog articles and static web pages fulfill a twofold function. They not only provide useful information to our existing users but also act as searchable content to draw new visitors to our website. Our Published and Intel blog pieces garnered 47.4K views, whereas the rest of our website pages attracted 99.4K views.
| Analytics category | June 2023 | 9-month average | % change |
| Published and Intel blog views | 39.4K | 44.7K | -11.9 |
| Other pages views | 82.9K | 94.8K | -12.6 |
The top 5 articles on our Intel blog in June were:
Expert Advice: Writing a Photographer Bio
Pricing & Negotiating: Licensing Extension For Hotel Shoot
Expert Advice: Photo Agent Contracts
Expert Advice: Google Search Console For Photographers
Expert Advice: Self-publishing A Photobook
The top 5 articles on our Published blog in June were:
Forging New Relationships: Tadd Myers For Arcosa
Guide: Wonderful at Work
13 Best Food Photographers in New York City
8 Best Food Photographers in Atlanta
10 Best Product Photographers in Chicago
Have questions about how we promote our photographers? Check out our Membership page. Want to know how you can get the most out of your Wonderful Machine membership? Check out our Jumpstart page or just reach out!