Please enter your email and website or LinkedIn to receive more information about our free and paid accounts.
Please enter your email address below and we’ll send you instructions on how to change your password.
Our website received 9.1K visitors in May, with an average interaction time of 2 minutes and 10 seconds per user.
The Reports snapshot provide a concise summary of the traffic on our website. It includes data on the aggregate number of users, new visitors, and the average time they spend engaging with our site.
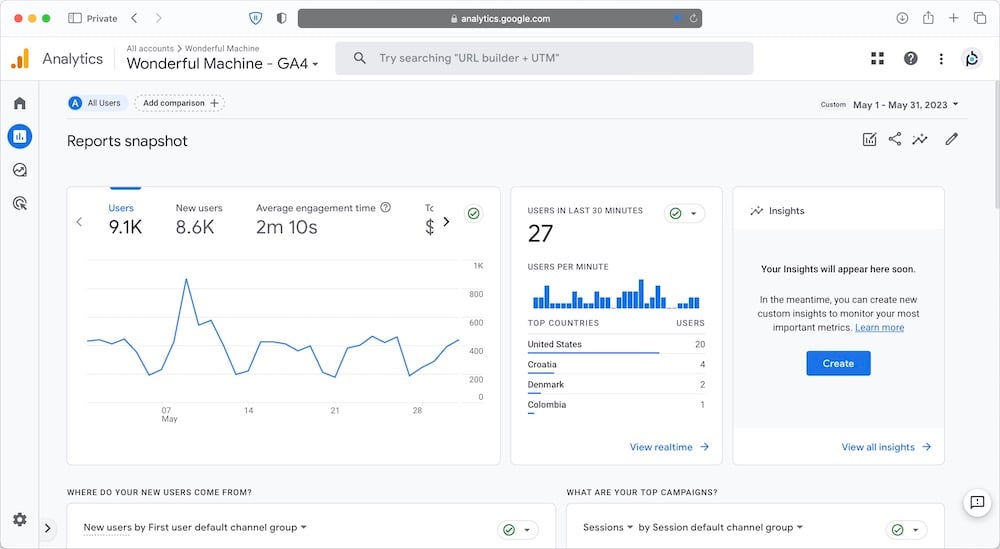
When looking at our 12-month average, traffic on our website was consistent in May, with 9.1K users checking it out. Of those visitors, 8.6K were new. The typical time spent on the site in May was 2 minutes and 10 seconds, a figure we got by dividing the total time users spent on the site by the overall user count.
The table below compares the traffic in May and our 12-month average.
| Analytics category | May 2023 | 12-Month Average | % Change |
| Users | 9.1K | 9.1K | +0.0 |
| New users | 8.6K | 9.1K | +0.0 |
| Average engagement time | 2m 10s | 2m 06s | +3.2 |
The Demographics Overview feature in Google Analytics 4 offers a detailed representation of the user profile for our website, covering aspects like their geographical location (countries and cities), gender, and language.
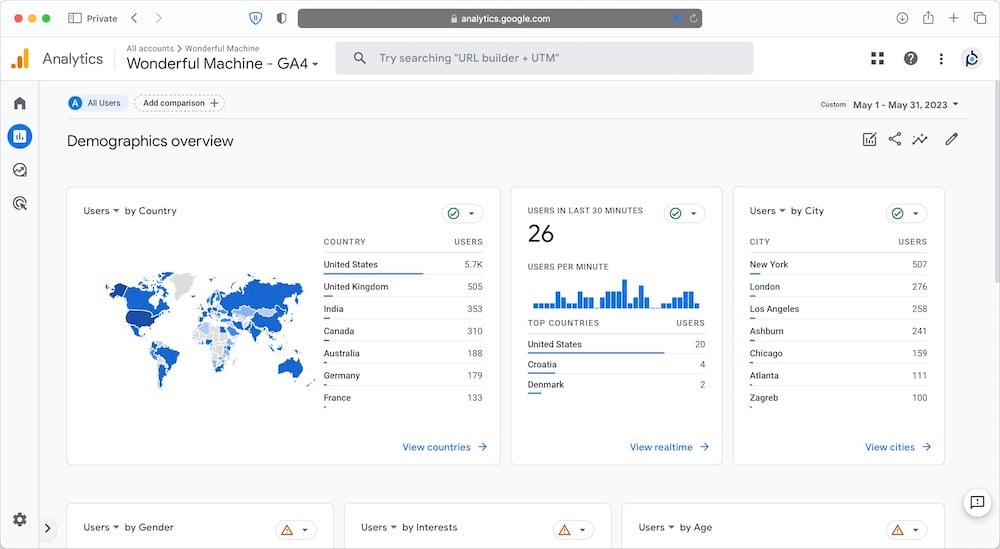
In May, an estimated 63% of the visitors to our website were located in the United States. The top five countries contributing to our user base were the United States, the United Kingdom, Canada, India, and Canada.
When it comes to the top five cities of our users, New York took the lead, trailed by London, Los Angeles, Ashburn, and Chicago.
The Traffic Acquisition report delivers valuable data about how users are finding our website.
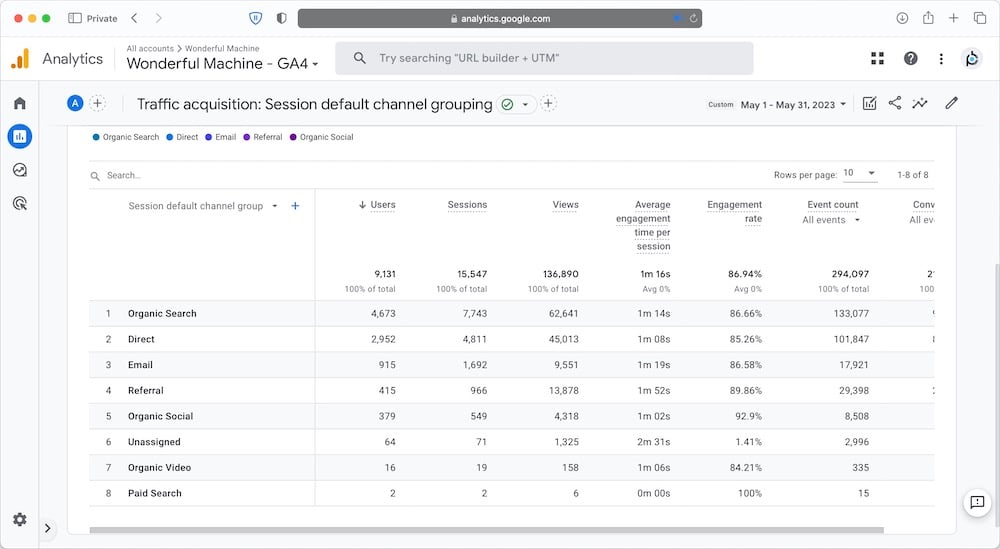
The main sources of traffic in May were Organic Search, Direct, Email, Organic Social, and Referral.
The Social Media Traffic Report shows the count of visitors who reached our website by clicking links from our social media platforms.
Our website received 488 visitors via social media channels in May. Below is a distribution of this traffic across different platforms:
Below is a detailed account of the metrics we track for our Find Photographers page.
| Analytics category | May 2023 | 8-month average | % change |
| Users | 1.2K | 1.0K | +20.0 |
| Views | 4.7K | 4.9K | +4.1 |
| Views per user | 3.9 | 4.8 | -18.8 |
In May, the engagement with our ‘Find Photographers’ page maintained a steady rate, attracting 1.2K users to our photographer search tool, yielding an average of 3.9 page views per user. Every page view could symbolize a single search or numerous search result pages, with each page showcasing a maximum of 25 search outcomes.
We offer two distinct methods for our users to search for photographers. They have the option to either browse photographer galleries or search photographer profiles. Although the profile view offers useful information about the photographers, sometimes perusing galleries proves to be more convenient. Here’s a comparative analysis of the usage between the ‘Find Photographers’ and ‘Browse Photographers’ pages.
| Type | Searches | Users |
| List | 3.5K | 687 |
| Browse | 1.2K | 501 |
In May, we recorded 1.3K users who engaged with the “Find” button. These 1.3K users accounted for a cumulative 7.4K button clicks. The detailed distribution is as follows.
| Page | Clicks | Users |
| Find Photographers | 3.2K | 848 |
| Find Clients | 1.6K | 39 |
| Homepage | 650 | 502 |
| Find Crew | 570 | 108 |
| Read Intel | 490 | 108 |
| Find Agents | 272 | 16 |
| Read | 241 | 26 |
| Read Published | 187 | 48 |
| Find Resources | 129 | 10 |
| Find Unpublished | 4 | 3 |
A total of 711 users interacted with photographer profiles. This interaction implies a click on the photographer’s website, email, phone, Instagram profile, LinkedIn profile, about section, and so forth. These 711 users accounted for a total of 6.0K engagements. A detailed segregation is presented below.
| Link type | Clicks | Users |
| Website | 4.0K | 533 |
| 645 | 180 | |
| About | 394 | 101 |
| 222 | 51 | |
| 140 | 45 | |
| Unpublished | 101 | 28 |
| BTS | 17 | 8 |
| Phone | 7 | 6 |
| Wikipedia | 6 | 4 |
| Agent | 2 | 2 |
Our blog posts and static pages have two roles: they provide valuable information for our current users and act as searchable content to draw in new visitors to our site. Our ‘Published’ and ‘Intel’ blog posts collected 40.8K views, whereas our additional website pages drew in 96.1K views.
| Analytics category | May 2023 | 8-month average | % change |
| Published and Intel blog views | 40.8K | 45.1K | -9.5 |
| Other pages views | 96.1K | 94.7K | +1.5 |
The top 5 articles on our Intel blog in May were:
The top 5 articles on our Published blog in May were:
Have questions about how we promote our photographers? Check out our Membership page. Want to know how you can get the most out of your Wonderful Machine membership? Check out our Jumpstart page or just reach out!