Please enter your email and website or LinkedIn to receive more information about our free and paid accounts.
Please enter your email address below and we’ll send you instructions on how to change your password.
Our website registered 10.4K Users in October, who navigated across 90.2K pages. On average, each User spent 2 minutes and 13 seconds with our content.
We modified our Google Analytics 4 configuration so that it reflects the amount of views more accurately. The previous version of Google Analytics (Universal Analytics) reported the number of page views. When it comes to Google Analytics, it’s all based on events and triggers that cause them. We modified our configuration to remove some irrelevant triggers that caused our analytics to track irrelevant Views (for example, the views caused by scrolling or clicking on a particular element of the page). As a result, the total amount of Views will be lower, but it will show the amount of page views precisely.
The Reports Snapshot summarizes our website’s activity, detailing the total count of Users, New users, and their average engagement time.
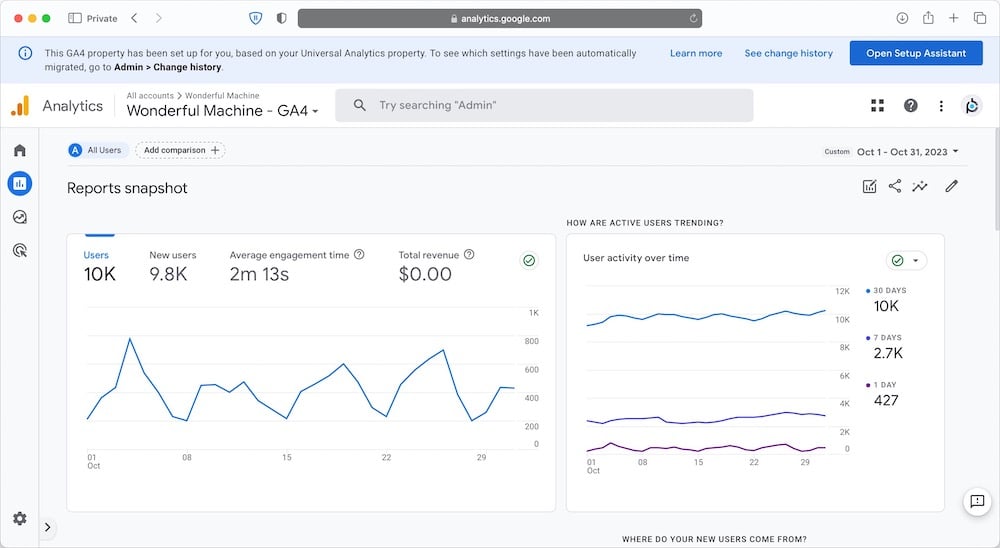
Compared to our recent average, October saw an increase in traffic.
| Analytics category | October 2023 | 12-Month Average | % Change |
| Users | 10.4K | 9.3K | +11.8 |
| New users | 9.8K | 9.2K | +6.5 |
| Average engagement time | 2m 13s | 2m 14s | -4.4 |
The User attributes overview section in Google Analytics tracks the location, gender, and language preferences of our Users.
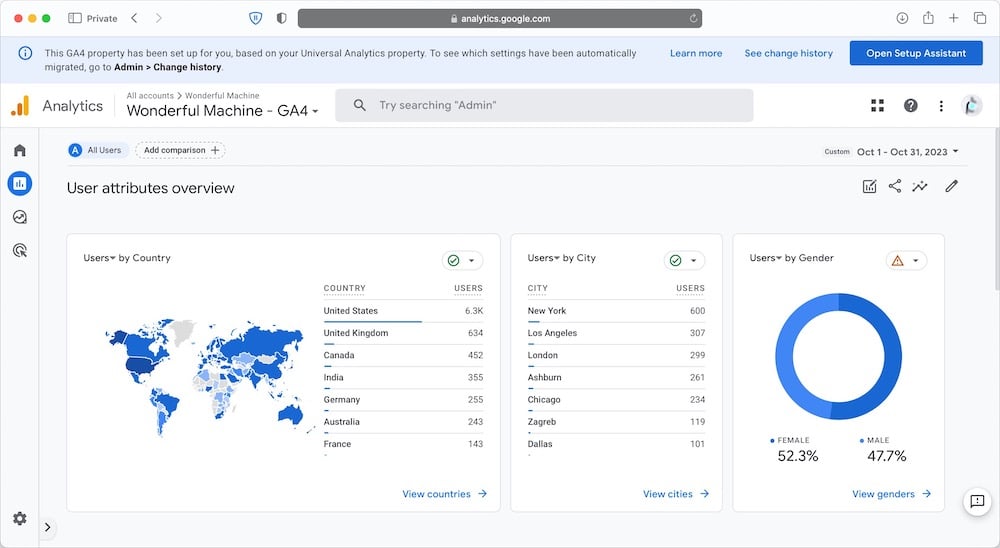
In October, the United States accounted for 61% of our traffic, with the United Kingdom, Canada, India, and Germany trailing behind.
New York led the way in city-based visits, with Los Angeles, London, Chicago, Ashburn, Virginia and Chicago in pursuit.
It’s interesting to see that Ashburn is in the top 5 cities. We have exactly two clients in our database who have offices there: DXC Technology and Van Metre Companies, so it’s a bit of a puzzle to find so many searches coming from there.
The Traffic Acquisition report reveals the pathways users take to reach our website.
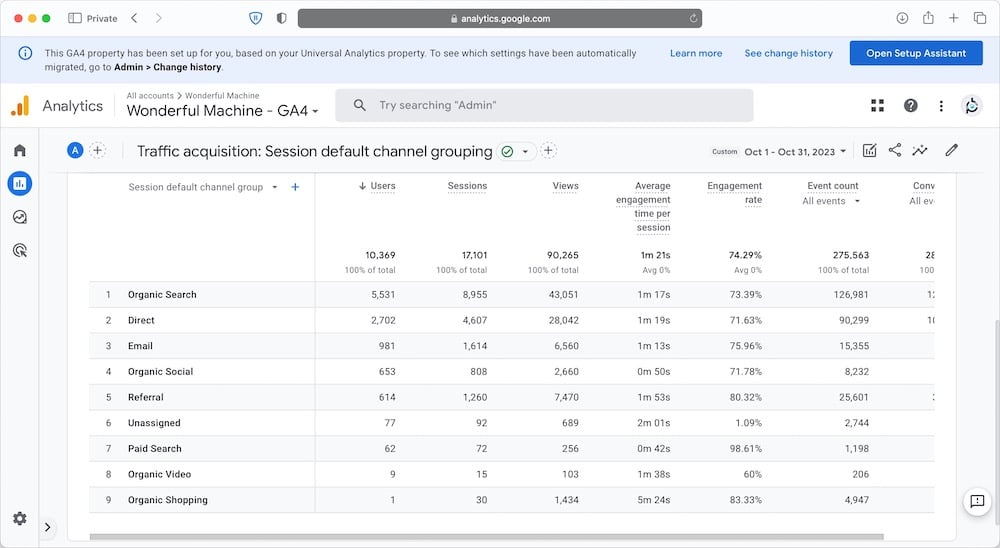
The main traffic sources in October were Organic Search, Direct, Email, Organic Social, and Referral.
The Social Media Traffic analysis indicates that 636 users landed on our website via our social media links. Here’s the distribution:
In addition to the public directories of Photographers and Crew that anyone can search on, we also have private directories of Clients, Agents, and Resources.
In October, 1.7K Users viewed 7.8K pages of profiles (when a user scrolls through 25 profiles, GA4 records that as a View).
| Page | Users | Views |
| Find Photographers | 1.4K | 5.0K |
| Find Crew | 170 | 990 |
| Find Clients | 50 | 1.2K |
| Find Agents | 20 | 340 |
| Find Resources | 11 | 229 |
Of our 10.4K Users in October, 2.2K visited the “Find Photographers” page. These Users performed 5.0K searches.
Our website gives clients two different ways to view our photographer directory. Our home page defaults to the Gallery view and the Photographers tab in the Find menu defaults to the List view.
| Type | Users | Views |
| List View | 840 | 3.6K |
| Gallery View | 576 | 1.4K |
Interestingly, even though the List view and Gallery view attract similar user numbers, the List view sees three times more search activity.
934 users engaged with a photographer’s profile, cumulatively resulting in 7.5K interactions. Here’s the detailed breakdown:
| Link Type | Users | Clicks |
| Website | 684 | 5.0K |
| 209 | 653 | |
| About | 119 | 353 |
| 80 | 261 | |
| 42 | 155 | |
| Unpublished | 41 | 76 |
| BTS | 14 | 34 |
| Phone | 17 | 18 |
| Agent | 7 | 9 |
| IMDB | 1 | 1 |
Photographers can showcase their self-assigned projects, which are available for licensing, in a section of our website called Unpublished. It’s accessible from the Read menu as well as from each individual photographer’s profile.
| Page | Users | Views |
| Unpublished | 125 | 680 |
The static Pages on our website (most of which live in our Consult and About menus) attracted 67.8K views.
| Page | Users | Views |
| Stock | 67 | 131 |
| Consulting Services | 78 | 246 |
| Design | 60 | 204 |
| Marketing | 146 | 604 |
| Photo Editing | 117 | 758 |
| Pricing & Negotiating | 115 | 360 |
| Publicity | 43 | 96 |
| Shoot Production | 418 | 953 |
| Mission | 226 | 859 |
| Team | 279 | 663 |
| Successes | 92 | 161 |
| Press | 33 | 65 |
| Specialties | 77 | 165 |
| Membership | 414 | 969 |
| Jumpstart | 26 | 96 |
| Terms | 38 | 66 |
| Privacy | 15 | 34 |
| Contact | 114 | 252 |
Our Published and Intel blogs received 34.4K views. The articles on our blogs serve a dual purpose: they deliver insightful information to our audience and act as search magnets, attracting new visitors to our site.
The table below highlights how the articles on our website not only furnish our readers with valuable insights but also attract new visitors to our site. Tracking these articles is straightforward due to their uniform URL structure. Conversely, we don’t monitor traffic for Photographer Spotlights or Case Studies partly because they don’t have a consistent URL structure, but also because we write Photographer Spotlights to promote our members and we write Case Studies to promote our consultants (which we do irrespective of the traffic).
| Page | Users | Views |
| Expert Advice | 2.1K | 5.4K |
| Listicles | 908 | 1.9K |
| Specialty | 535 | 1.3K |
| Crew | 408 | 962 |
The top 5 Photographer Spotlight articles in October were:
The top 5 articles on our Published blog in October were:
The top 5 articles on our Intel blog in October were:
Have questions about how we promote our photographers? Check out our Membership page. Want to know how you can get the most out of your Wonderful Machine membership? Check out our Jumpstart page or just reach out!