Please enter your email and website or LinkedIn to receive more information about our free and paid accounts.
Please enter your email address below and we’ll send you instructions on how to change your password.
In March, our website attracted 12.2K users who, on average, spent 1 minute and 57 seconds interacting with our site.
The Reports Snapshot summarizes our website’s traffic, encompassing data on the total count of users, new users, and the average duration of their engagement with our site.
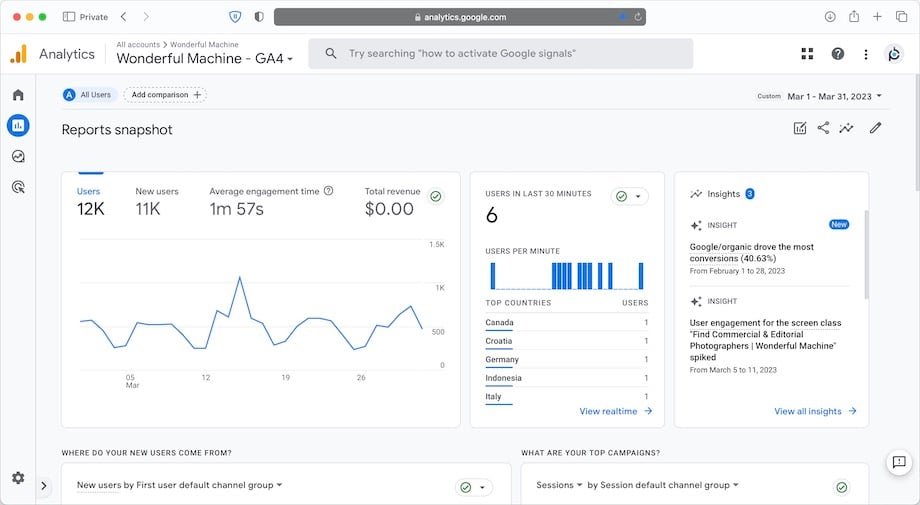
In March, our website witnessed sustained expansion, with a total of 12.2K Users visiting our site. Among them, 11.4K were New users who accessed our website for the first time. The average engagement time in March was 1 minute and 57 seconds, calculated by dividing the total time Users spent on our website by the number of Users.
The table below compares the traffic in March and our ten-month average.
| Analytics category | March 2023 | 10-Month Average | % Change |
| Users | 12.2K | 8.9K | +37.1 |
| New users | 11.4K | 8.9K | +28.1 |
| Average engagement time | 1m 57s | 2m 03s | -4.9 |
The Demographics Overview feature of Google Analytics 4 covers a comprehensive snapshot of our website’s user profile, including information on their location (countries and cities), gender, and language.
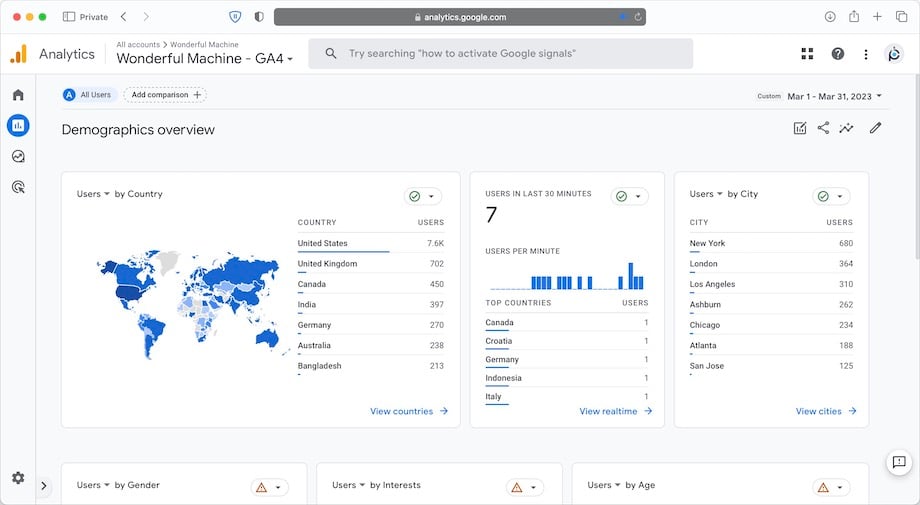
In March, around 65% of our users were from the United States, while the remaining 35% were from other countries. Our users’ top five countries of origin were the United States, the United Kingdom, Canada, India, and Germany.
In terms of the top five cities where our users reside, New York retains its position as our leading city, succeeded by London, Los Angeles, Ashburn, and Chicago.
The Traffic Acquisition report provides valuable insights into the ways in which users discovered our website.
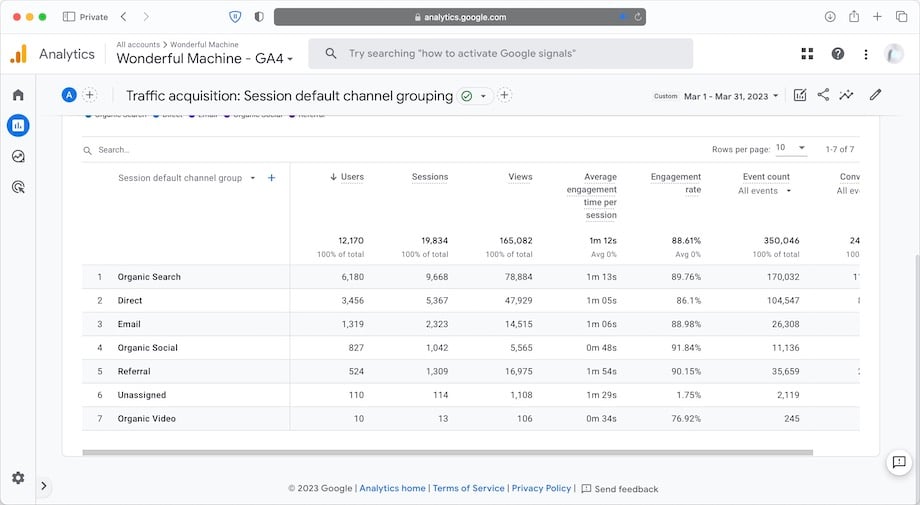
Our top traffic sources in March were Organic Search, Direct, Email, Organic Social, and Referral.
The Social Media Traffic Report exhibits the count of users who landed on our website by clicking links on our social media platforms.
Overall, 610 users arrived at our website through social media in March. The following is a breakdown of the social media traffic:
Here is a breakdown of the metrics we track for our Find Photographers page.
| Analytics category | March 2023 | 6-month average | % change |
| Users | 1.4K | 1.0K | +40.0 |
| Views | 5.5K | 4.8K | +14.6 |
| Views per user | 3.9 | 4.9 | -20.4 |
In March, our Find Photographers page witnessed a slight increase in usage, with 1.4K individuals using our photographer search feature, with an average of 3.9 page views per person. Each page view could indicate a single search or multiple search result pages, with each page displaying up to 25 search results.
Compared to our 6-month average, photographer searches increased by 40% in March. We attribute the growth to implementing the photographer search option on our home page. By providing this new feature, we have made it easier for our users to find and connect with photographers. We are pleased to see the positive impact of a new addition and will continue to strive towards enhancing the user experience on our website.
Our blog posts and static pages fulfill a dual role, presenting helpful information for our users while simultaneously serving as searchable content to draw in new visitors to our site. Collectively, our Published and Intel blog articles accumulated 48.8K views. Moreover, the views on our other website pages had a total of 116.2K views.
| Analytics category | March 2023 | 6-month average | % change |
| Published and Intel blog views | 48.8K | 36.2K | +34.8 |
| Other pages views | 116.2K | 98.1K | +18.5 |
The top 5 articles on our Intel blog in March were:
The top 5 articles on our Published blog in March were:
Have questions about how we promote our photographers? Check out our Membership page. Want to know how you can get the most out of your Wonderful Machine membership? Check out our Jumpstart page or just reach out!